
You’ve rented an apartment out for an entire year and now the tenant is moving out. They leave, and it sits empty for two weeks before another tenant moves in.
So, you have roughly 4% vacancy, right? 2 Weeks out of 52 weeks is about 4%….
Wrong…
Vacancy rates are one of the most misunderstood parts of real estate investing, and today I’m going to set the record straight.
In this article we’ll cover:
- What is physical vacancy and how to calculate it? It’s probably what you think of when you think of “vacancy,” but does it capture the whole story?
- What is economic vacancy and how is it different? We’ll cover this in a lot of detail so you walk away with a solid understanding of it.
- We’ll show you exactly how physical and economic vacancy change your numbers when you’re calculating potential returns.
Physical Vacancy in Rental Property
The physical vacancy rate of a rental property is the actual time it sits vacant in any given year. Here’s the formula:
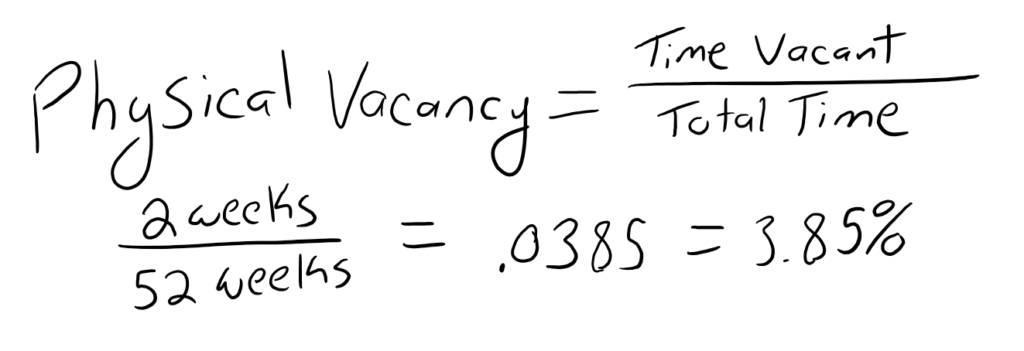
You can be more precise by calculating it by the number of days vacant. 14 days vacant / 365 days = .0384 = 3.84%
What is Economic Vacancy?
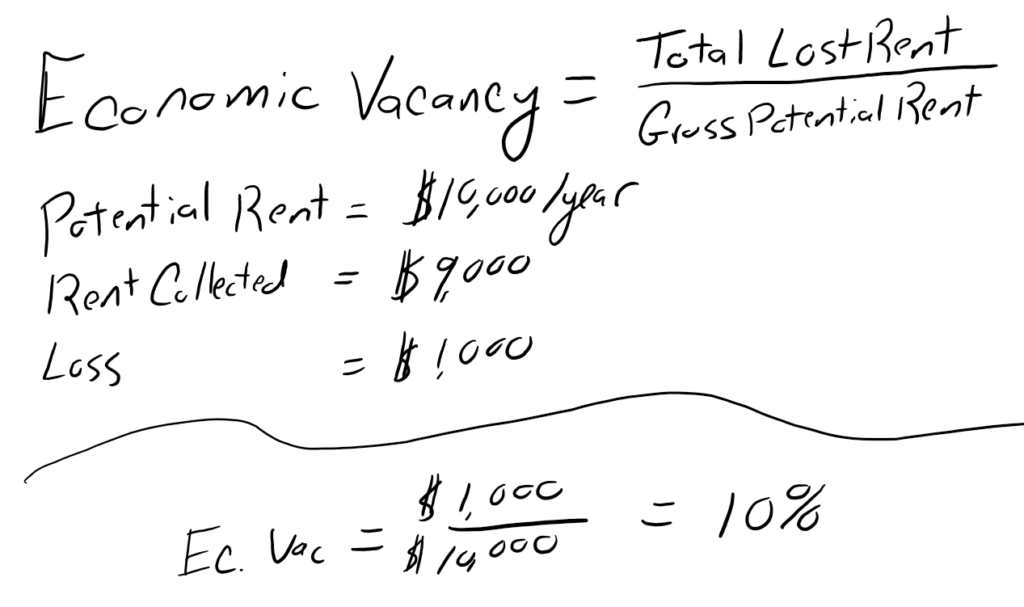
Economic vacancy, or what I like to call True Vacancy, is the total loss of rent as compared to your total Gross Potential Rent. It is more accurate than physical vacancy because it is calculating your vacancy based on money rather than on time.
By calculating it in dollars rather than days, we are able to capture a lot more variables.
Here’s the formula:
What’s included in Economic Vacancy?
As you know already, physical vacancy includes just the actual empty time.
If we were to capture this in the format of economic vacancy, it would be pretty straightforward.
If the rent is $1,000 per month and you lost 14 days of rent:
Potential Rent = $12,000
14 Lost Days / 30 Days in Month = .4666
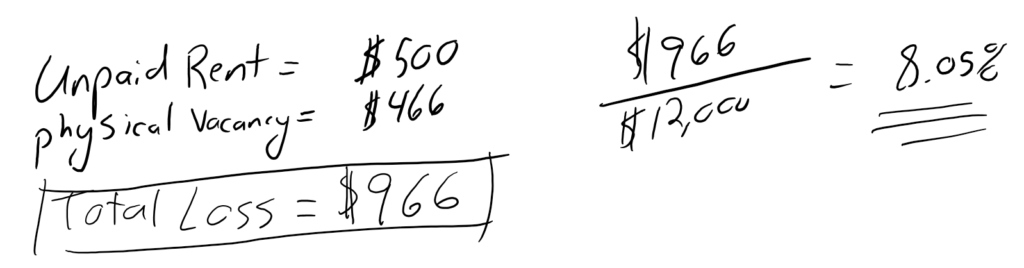
$1,000 * .4666 = $466 Lost Rent
$466/$12,000 = 3.88%
But, as you’re going through this, you’re probably starting to notice that other things will be captured in this number as well
Loss to Bad Debt
Bad debt is any time someone owes you and fails to pay.
This could be (but not limited to):
- Owed rent but didn’t pay.
- Unpaid utility chargebacks
So, if in the above example you had 2 weeks of vacancy (or $466 loss of rent) but also had a tenant not pay the rent and needed to be evicted.
Let’s say they Didn’t pay rent on the 1st, and by the 15th you had them evicted (I’m being generous here to keep the examples simple).
Loss to Lease
Another potential vacancy item is what’s called loss to lease.
This is the loss due to renting out a unit below the actual market rent.
Let’s say your old lease was at $1,000 but the market has changed a bit and the market rent for a unit like yours is $1,050. But, due to the eviction and problems you just want it rented out fast, so you rented it for $1,000 again.
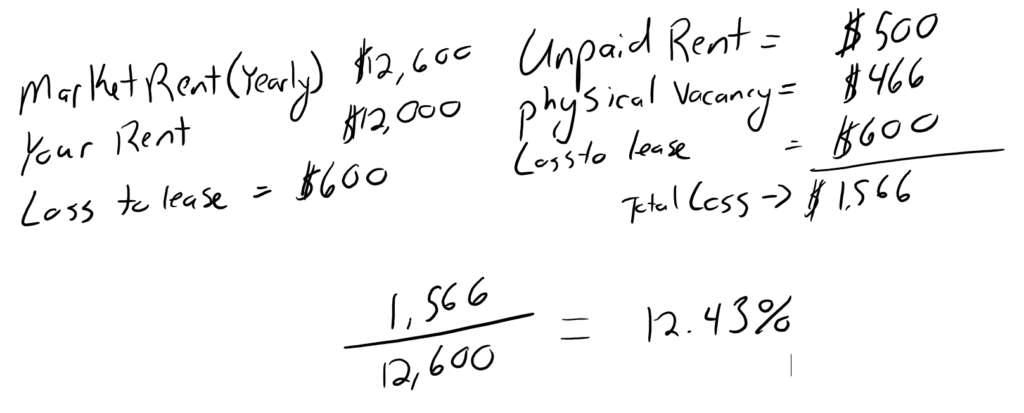
You’ll notice this time I took the total loss and divided by the potential rent instead of the actual rent collected. I made this change because we’ve finally included Loss to Lease.
You can see how it’s all starting to develop.
Other Economic Vacancy Expenses
Economic vacancy will also include model unis, manager’s unit, any unit that is ‘down’ and not rentable or requiring a lot of extra repairs to turn it over.
I’m not going to dive into every potential item. Now that you have the fundamentals you can easily continue on and keep adding in items yourself.
[/fusion_text][fusion_text]
Analyzing a Deal With Economic vs Physical Vacancy
Let’s run through a quick deal and compare what happens to your returns with and without properly accounting for vacancy.
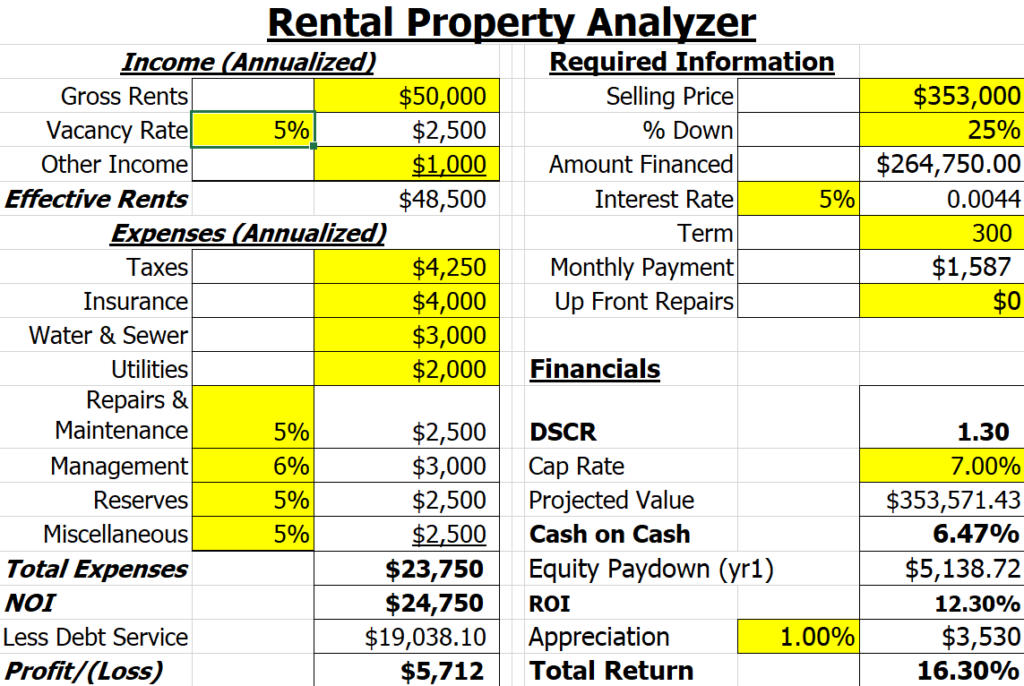
I’ve used my quick and dirty deal analysis calculator to estimate the returns on a potential deal. You can download a copy for yourself for free.
Here is a simple example of a deal that has OK cash flow but a decent total return once accounting for appreciation and equity pay down.
I’ve chosen this deal because it’s realistic – not awesome but not terrible either.
Anyhow, you can see that there is a 5% vacancy factor included, which is a pretty standard number to use, especially in residential (1-4 unit) analysis.
Now, let’s go back and add a few more percentage points into account for evictions, bad debt, etc.
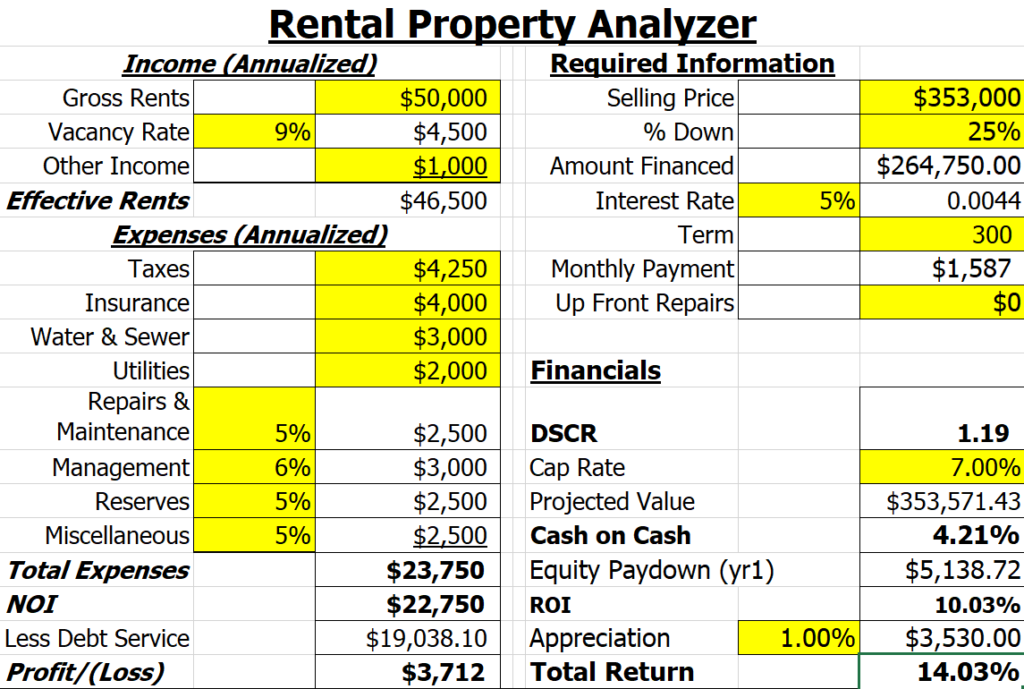
As you can see, the cash on cash return drops dramatically from roughly 6.5% to 4.25% and the overall return drops by a similar amount.
Note* I’ll point out that the projected value in a commercial property is based on the cap rate, but since this article is geared toward educating residential investors about something that is used commonly in the commercial space, I intentionally didn’t base the return on it. With this calculator, you can simply adjust the projected value to anything you want, or base it on the cap rate.
Do Not Use Physical Vacancy When Analyzing Deals
Plain and simple.
NEVER use just physical vacancy. By overlooking this important aspect of deal analysis, you could really be losing a lot of money.
Eric Bowlin has 15 years of experience in the real estate industry and is a real estate investor, author, speaker, real estate agent, and coach. He focuses on multifamily, house flipping. and wholesaling and has owned over 470 units of multifamily.
Eric spends his time with his family, growing his businesses, diversifying his income, and teaching others how to achieve financial independence through real estate.
You may have seen Eric on Forbes, Bigger Pockets, Trulia, WiseBread, TheStreet, Inc, The Texan, Dallas Morning News, dozens of podcasts, and many others.
Leave a Reply